


Dynadot published their Q2 domain intelligence report. I have listed a few excerpts below. Full report here
2. How Order Price Shapes Aftermarket Volume and Value
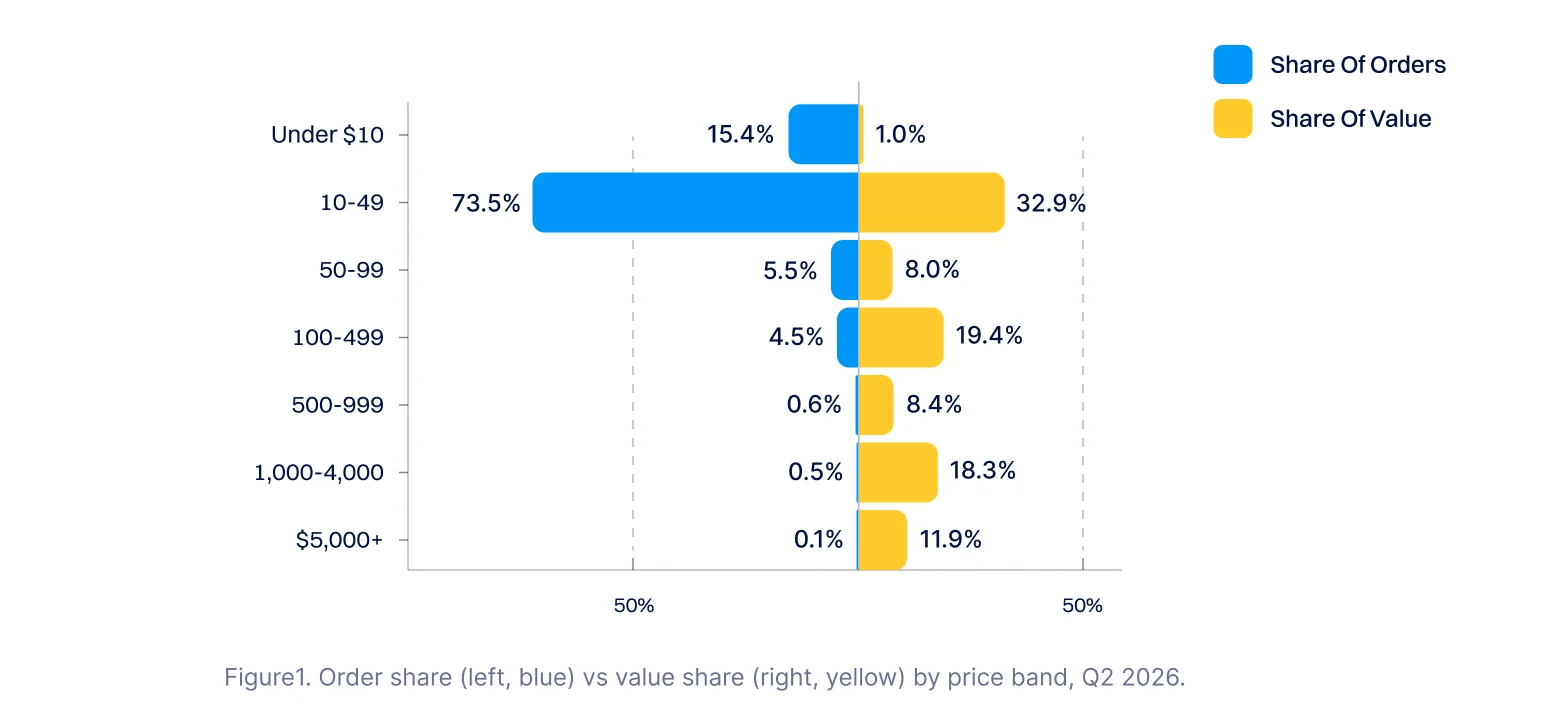
Under 1% of aftermarket orders generated close to a third of marketplace value, and so did the entire sub-$50 tier.
- The top of the market: orders above $5,000 were roughly seven in ten thousand, and carried 11.9% of value on their own.
- The volume tier: 88.9% of orders under $50 produced 33.9% of value.
- The $1,000+ tier: under 1% of orders, contributing close to a third of value.
The marketplace floor and the marketplace summit contribute about equally, from bases three orders of magnitude apart. The aftermarket reads as a volume business and behaves as a long-tail one at the same time, which is why single-metric summaries of it tend to miss half the picture.
Where orders live vs where value lives, Q2 2026
.com led transaction volume
.com took seven in ten orders, and 354 distinct TLDs traded in Q2 2026. Volume and price rank close to inversely: .com holds 70.6% of orders at roughly 1.0x the market average, because it is where the high-volume, lower-priced end of the market transacts, while the highest-priced extensions each sit under 1% of volume.
.io is the honest premium story here, with a median of $61.49, more than three times the market median.
.us shows a 2.74x average but a $14.95 median; that average is driven by a few large sales and shouldn’t be quoted on its own.


Leave a Reply